Fundamentals of Data Analytics (32130) Week 8
Classifier
its job is to tell you the probability of how accurate it is.
classifier will create a line to separate all the values, instead of scatter plot, transfer the representation of indiv value to distribution representation = ROC curve
Confusion Matrix
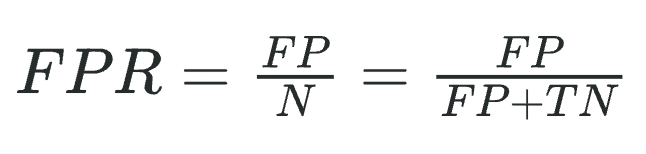
Type I error FP
falsely predicted as positive, obvious errors
Type II error FN
was actually positive but were predicted negative
Measures of performance
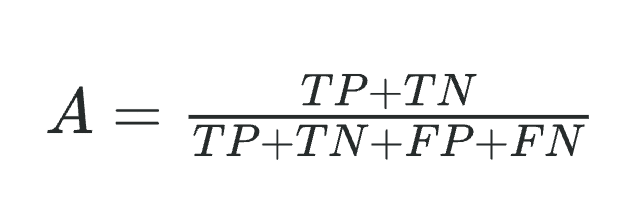
Accuracy rate
the ratio of correct predicitions to all predictions.
Number of true positives and true negatives / total number of predictions
Error rate
the ratio of incorrect predictions to all predictions, (1 - accuracy). Number of false positives and false negatives divided by the total number of predictions.
ROC curve
Receiver Operating Characteristic (ROC) curve
uses accuracy and error rate
True Positive Rate vs False Positive Rate
straight diagonal line: the results are the same, can’t distinguish between positive and negative = Random Classifier
50% chance of getting the right answer - very bad model.
AUC
Area under the ROC curve
probability that the model will rank the positive higher than the negative
the accuracy
KNN
doesn’t need to specify learner and predictor node
The only one